
Error Covariance vs Correlation for Data Models: Why the Difference Matters More Than You Think
I once spent three days debugging a Kalman filter that kept blowing up on me. Seriously. I checked the gains, the measurements, the state transition matrix—everything looked clean. Then I realized the problem. Some junior engineer had hardcoded a correlation matrix where the error covariance was supposed to live. The model looked fine on paper, but the moment it hit real sensor data, it went haywire. That’s the kind of mistake that makes you want to throw your laptop out a window.
If you’re working with data models—whether for weather forecasting, robotics, or financial risk—you need to know the difference between error covariance vs correlation. They’re not interchangeable. They’re not even cousins. They’re more like apples and the price of apples. One tells you the relationship. The other tells you the relationship and the scale of the mess.
The Fundamental Distinction: What Are We Actually Measuring?
Let’s strip this down to the core. Error covariance is a measure of how two variables vary together, and it’s expressed in the same units as the variables themselves. If you’re tracking position and velocity in meters and meters per second, your covariance matrix will contain entries like "5 m^2" or "2 m·m/s." It carries units. It carries magnitude. It tells you not just whether the errors are correlated, but how much they wiggle together.
Correlation, on the other hand, is a normalized version. It’s dimensionless. It lives between -1 and 1. It tells you the direction and strength of a linear relationship, but it ditches the scale. You can have two variables with wildly different variances that are perfectly correlated—and correlation will happily report a 1.0. That’s useful for some things. It’s dangerous for others.
Covariance Tracks the Raw Dance Between Errors
Think of error covariance as the raw footage of a dance. You can see exactly how much each partner moves, in what direction, and how those movements align. In a data model, the error covariance matrix captures the uncertainty of each state variable and the degree to which those uncertainties are linked. High covariance between two sensors? That means when one drifts, the other tends to drift in a similar way.
This is critical in sensor fusion and data assimilation scenarios. When you’re merging GPS and inertial measurements, the covariance matrix tells your filter exactly how much to trust each source. It’s the backbone of any decent Kalman filter or optimal estimation routine. Without the scale information, you’re flying blind.
Correlation Normalizes That Dance
Now, correlation takes that same footage and normalizes it. It asks, "Regardless of how big the movements are, how synchronized are they?" That’s a powerful question for exploratory data analysis and model diagnostics. If you’re trying to figure out which variables in your data model are redundant, correlation is your tool.
But here’s the trap. If you plug a correlation matrix into a Kalman filter update step, you lose all sense of magnitude. Your filter will think errors are smaller or larger than they actually are. The gains will be wrong. The innovation will look weird. And the whole thing will either diverge or give you results so wildly optimistic you’ll think your model is perfect—until you test it on real data. Look—I’ve been there.
Real-World Implications: Where the Rubber Meets the Road (and Fails)
It’s one thing to talk theory. It’s another to watch a multi-million-dollar simulation run off the rails because someone confused covariance vs correlation in a data model. I’ve seen it happen in aerospace, in oil & gas, and in finance. The symptoms are always the same: the model looks great in validation, then falls apart in deployment.
Kalman Filters and Sensor Fusion: The Trouble With Unscaled Data
In sensor fusion, you’re constantly dealing with error covariance updates. Your Kalman filter propagates the state and the covariance matrix forward in time. Then it uses the measurement covariance to compute the optimal gain. If you substitute a correlation matrix for the measurement covariance, you’re telling the filter that all your sensors have unit variance. They don’t.
Honestly? This is where I see beginners make the biggest mistake. They normalize their sensor data for training a machine learning model, then forget to un-normalize before plugging it into the data model. The filter treats every sensor error as having a variance of 1. If your GPS actually has a variance of 100 meters squared, the filter will trust it way too much. The result? A trajectory that looks smooth but is completely wrong.
- Use error covariance when you need to propagate uncertainty through time. - Use correlation only for analysis, not for filter updates. - Always check the units of your matrix entries. If they don’t make sense for your problem, something is off.
Data Assimilation in Weather Models: Why Correlation Can Mask Systematic Bias
Weather forecasting is a brutal test of any data model. You’ve got millions of observations from satellites, balloons, and ground stations, all with different error characteristics. Data assimilation systems like the ones used at weather centers rely on error covariance matrices to blend these observations with the model state.
If you use correlation instead, you lose the ability to weight observations properly. A satellite radiance with high error variance will get the same treatment as a radiosonde with low error variance. That’s a recipe for a bad forecast. Worse, correlation can mask systematic biases. Two instruments might be highly correlated in their errors because they share a common calibration issue. Correlation shows you the link but not the magnitude. Covariance flags both.
1. Covariance reveals absolute magnitude of joint uncertainty. 2. Correlation shows relative strength of relationship. 3. Covariance is required for optimal weighting in data assimilation. 4. Correlation is a diagnostic tool, not a plug-and-play metric.
And here’s a fun fact: many data assimilation systems actually store the covariance matrix in a factored form precisely because it’s so crucial to get the scale right. They don’t bother with correlation unless they’re doing pre-processing.
Practical Guidance: When to Use Covariance, and When to Normalize
Alright, let’s get concrete. You’re building a data model and you’re staring at a big matrix of numbers. How do you decide which one to use? The answer depends entirely on what you’re doing with the output.
For Tuning and Diagnostics, Correlation Is Your Friend
If you’re debugging your model or trying to understand why certain variables are tangled together, pull out the correlation matrix. It removes the noise of different units and lets you see the structure. In machine learning pipelines for error covariance estimation, I often start by looking at the correlation matrix to identify clusters of highly dependent variables.
But here’s the thing—don’t stop there. Correlation is a snapshot. It doesn’t tell you the magnitude of the uncertainty. If two sensors have a correlation of 0.99 but one has a variance of 0.001 and the other has a variance of 1000, the practical impact is asymmetric. The high-variance sensor will dominate the error covariance anyway, despite the strong correlation. You need both pieces of information.
- Use correlation to find redundant variables. - Use covariance to quantify the actual risk. - Never report a correlation matrix without also reporting variances. - If your data model involves optimization, always keep the covariance structure.
For Propagation and Updates, Covariance Is Mandatory
When you’re updating your model’s state—whether through a Kalman filter, a particle filter, or a variational assimilation scheme—you must use error covariance. There’s no shortcut. The scale is baked into the math. If you try to use correlation for the update step, the equations break. They literally require the covariance matrix to be positive semi-definite with proper scaling.
I once worked with a team that tried to 'simplify' their data model by assuming unit variances across all variables. It took them months to realize that their supposedly "good" estimates were completely uncalibrated. The error covariance was off by orders of magnitude. The model looked precise but was wrong. That’s the kind of mistake that costs real money.
Look—you can’t cheat the math. The covariance matrix is the bridge between your uncertainty theory and your real-world data. The correlation matrix is a map of that bridge. You wouldn’t drive a truck across a map. Use the right tool.
Common Questions About Error Covariance vs Correlation for Data Models
What is the fundamental difference between error covariance and correlation?
The error covariance between two variables is the expected value of the product of their deviations from their means. It includes units and magnitude. Correlation is that same covariance divided by the product of the standard deviations. It’s a dimensionless quantity between -1 and 1. Covariance tells you how much they vary together; correlation tells you how consistently they vary together.
Why does scaling matter so much in data models?
Because data models don't just care about relationships—they care about the absolute size of errors. A Kalman filter, for example, uses the covariance matrix to compute the optimal gain. If you scale the covariance incorrectly (or use a correlation matrix instead), the gain will be wrong. You’ll either overcorrect or undercorrect, and your state estimates will diverge from reality. Scaling is the difference between a model that works and one that looks good on paper.
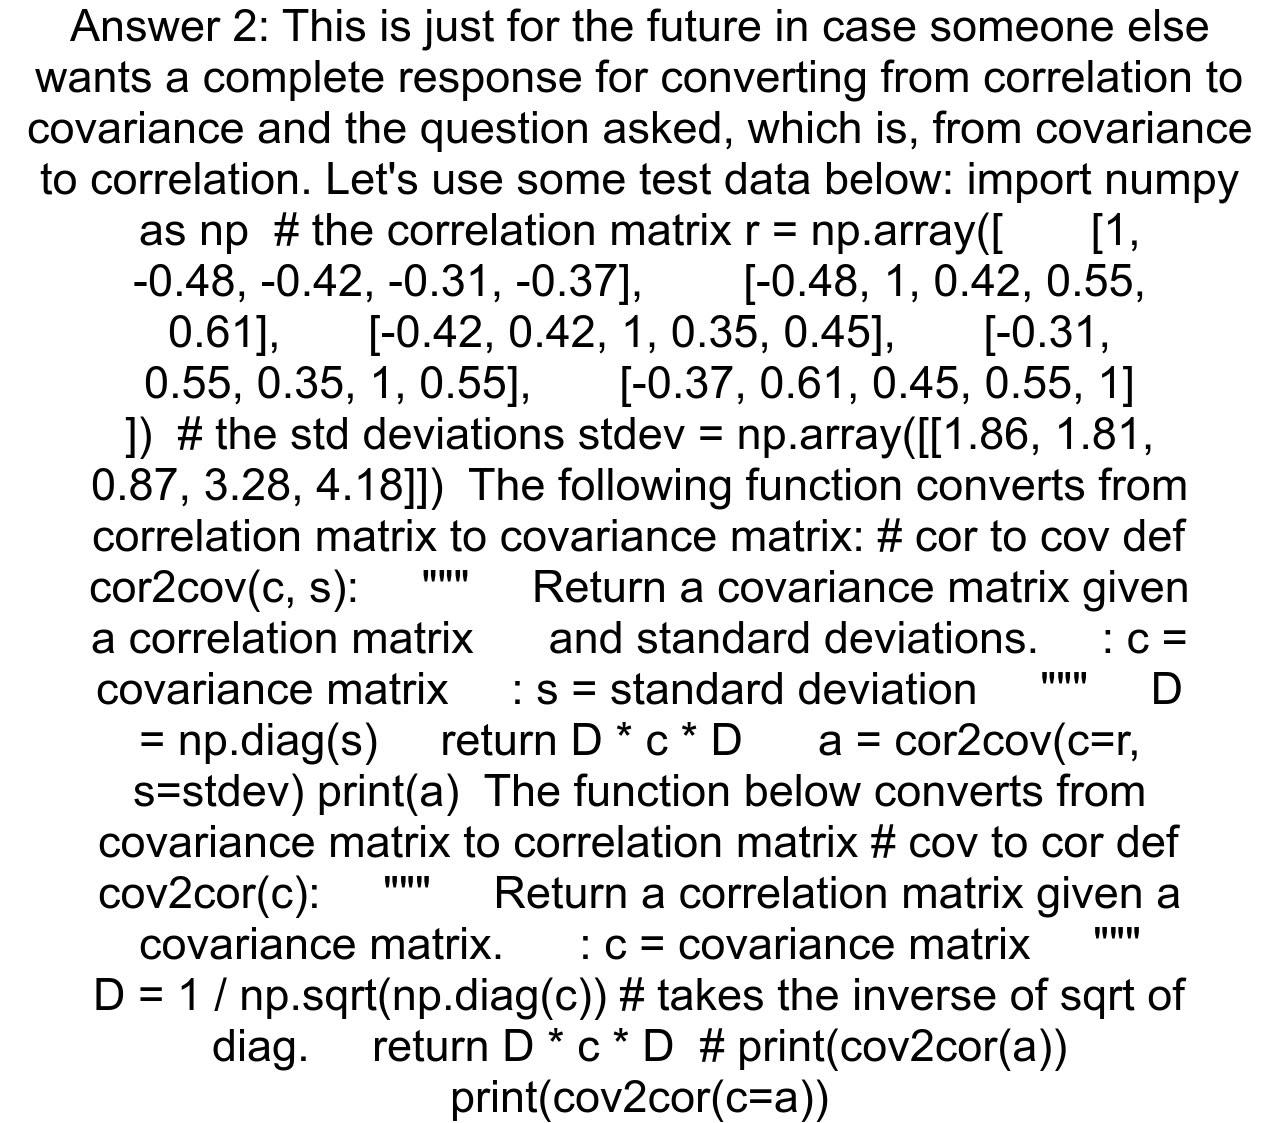
Can I convert a correlation matrix to a covariance matrix and use it directly?
Yes, but only if you know the standard deviations of all variables. The conversion is straightforward: covariance = correlation (std_dev_1 std_dev_2). If you have those standard deviations from your data or your sensors, you can reconstruct the covariance matrix. If you don’t have them, you’re guessing. And guessing the scale of uncertainty in a data model is a terrible idea.
When should I look at the correlation matrix instead of the covariance matrix?
Use the correlation matrix for exploratory analysis, feature selection, and diagnosing multicollinearity in your data model. It’s excellent for spotting relationships that might not be obvious from raw covariance values, especially when variables have different units. But always remember—correlation without scale is like a map without a legend. It shows you streets but not distances.