
The Real Difference Between Exponential J Curves and Logistic S Curves (and Why It Matters)
I remember watching a colony of bacteria in a petri dish back in grad school. For the first few hours, nothing happened. Just a tiny speck. Then, suddenly, it was like someone flipped a switch. The population doubled. Then doubled again. Then again. It was a beautiful, terrifying explosion of life. If you had plotted that growth on a graph, it would have looked like a hockey stick—a classic exponential J curve. But here's the thing nobody tells you: that party never lasts. Within two days, that colony was dead, suffocated in its own waste. The real world doesn't let you grow forever. Logistic S curves, on the other hand, tell the boring, practical, and far more realistic story of what happens when growth hits a wall. Look—if you're trying to understand viral marketing, population dynamics, or even why your startup is starting to plateau, you need to know this distinction inside and out. Seriously, it's the difference between understanding a bubble and understanding a sustainable system.
The J-Curve: When Growth Goes Absolutely Bonkers
Let's start with the fun one. The exponential J curve is what happens when a quantity grows by a constant percentage over a constant time period. It's not just adding ten new users every day; it's adding 10% more users every day. That's a compound effect. And compound effects look boring until they don't. Think of a penny that doubles every day for 30 days. Day one: one cent. Day ten: about five bucks. Day twenty: over five thousand dollars. Day thirty? Over five million dollars. That's the J-curve. It starts flat, then it goes vertical. Honestly? It's a seductive shape because it promises unlimited potential.
This shape is mathematically pure and devastatingly simple. It follows the formula N(t) = N₀ * e^(rt), where N₀ is your starting population, r is the intrinsic growth rate, and t is time. Exponential growth assumes the environment is limitless. There's infinite food, infinite space, and zero predators. In a petri dish, that holds true for a few hours. In a financial model, it holds true until a crash. In social media, it holds true until you run out of eyeballs. The key feature of a J curve is that there is no ceiling. It just keeps going up and to the right until something breaks. It's a big deal because it describes everything from the initial spread of a virus (before immunity kicks in) to the insane hype phase of a new cryptocurrency.
But here is where the J-curve gets tricky. It is completely unsustainable in any closed system. Exponential growth is the enemy of carrying capacity. Think about it—if bacteria doubled every hour, in just two days they would outweigh the entire Earth. It's physically impossible. So the J-curve is always a phase, never a permanent state. It's the early, explosive phase of a process that must eventually slow down. I've seen too many entrepreneurs chase this curve, convinced their user growth would stay at 10% week-over-week forever. It's a trap. A beautiful, intoxicating trap. The difference between exponential J curves and reality is that reality has limits.
So when do you actually see a true exponential J curve in practice? You see it in short bursts. The initial adoption of a trend on TikTok. The spread of a rumor in a tightly connected group. The growth of a bacterial culture in a fresh nutrient broth. But pay close attention—in every single one of those cases, the growth inevitably stops. The J-curve is a snapshot, not a movie. It's the first act of a tragedy about to unfold. Understanding this is the first step to not being fooled by a growth spurt that can't last.
What Makes a J-Curve Tick?
Three things have to be true for a J curve to appear. First, you need a high intrinsic growth rate. That's the "r" in the equation. Second, you need an environment that is, at least initially, free of constraints. No resource limits, no competition, no predators—whether biological or market-based. Third, you need positive feedback loops. Each new individual (or user, or dollar) helps create more. In a viral marketing campaign, one share creates two views, which creates four shares. It's a self-reinforcing cycle.
The math is elegant, but the reality is brutal. The same properties that make the J-curve explosive make it fragile. Because it relies on a constant rate, any disruption to that rate—like a competitor entering the market or a resource becoming scarce—can send the whole thing into a tailspin. I've consulted for startups that grew 400% in a month and thought they had cracked the code. Then they hit a ceiling. They didn't understand that their exponential growth was a temporary phenomenon, not a permanent strategy. The J-curve is a wonderful description of a phase, but a terrible model for a business plan. It's the difference between a sprint and a marathon.
One more thing—don't confuse the J-curve with simple linear growth. Linear growth adds a constant amount each period (like +100 users per day). Exponential growth adds a constant percentage each period (like +10% per day). The visual difference is stark. Linear growth looks like a gentle slope. Exponential growth starts gentle and then goes nearly vertical. It's the "hockey stick" shape every investor wants to see. But again, be skeptical. A hockey stick that keeps going is usually a sign of a bubble.
The Crash That Follows the High
This is the part of the story nobody wants to talk about. The inevitable crash. In ecology, we call it a "die-off." In finance, it's a "correction" or a "crash." In marketing, it's the "churn cliff." The J-curve never just stops—it overshoots and then collapses. Because the system was built on an assumption of unlimited resources, when the limits finally appear, they hit hard. The population exceeds the carrying capacity and then starves. The stock price overshoots the intrinsic value and then plummets. The user base grows faster than the product can support, leading to a terrible experience and mass exodus.
I've literally watched a yeast culture do this in a flask. It grows exponentially, consumes all the sugar, produces massive amounts of alcohol, and then dies in its own toxic brew. It's a perfect metaphor for any boom-and-bust cycle. The exponential J curve doesn't plateau gracefully; it peaks and then crashes. This is the fundamental reason why the logistic curve was invented. Humans (and nature) needed a model that could describe growth with limits. The J-curve is the adolescent fantasy of infinite possibility. The S-curve is the adult reality of working within constraints, and that's exactly where we're heading.
The S-Curve: The Mature, Boring, Practical Cousin
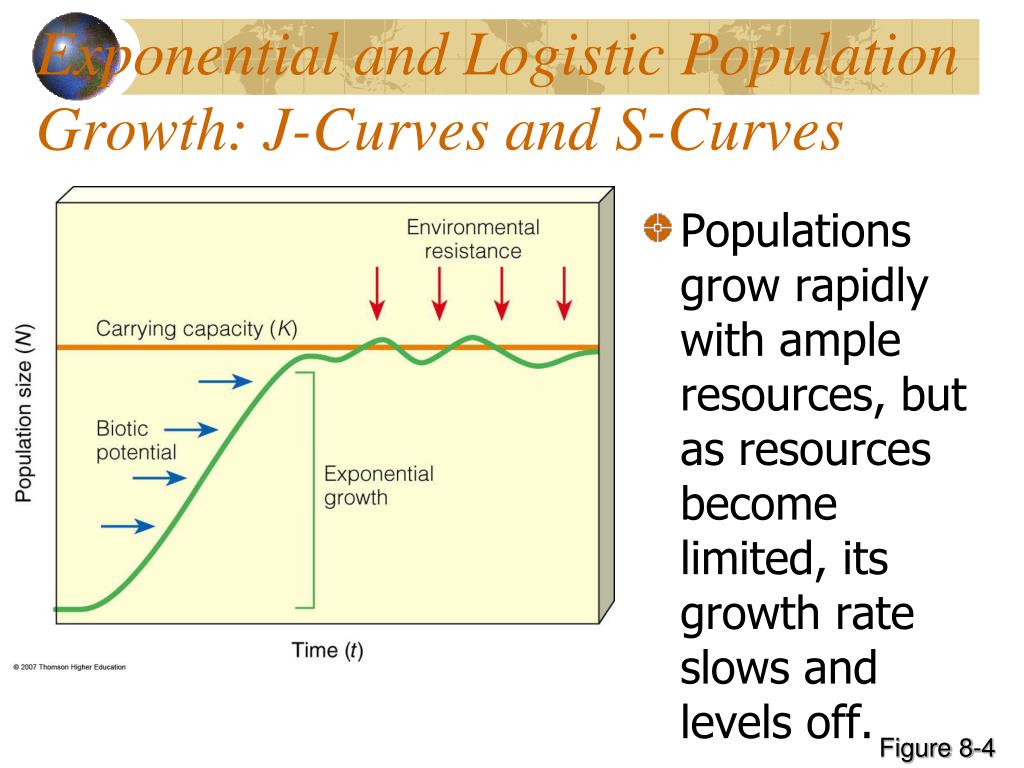
Now let's look at the logistic S curve. This is where things get real. The S-curve describes growth that starts slowly, accelerates into an exponential phase, and then decelerates as it hits a ceiling. It's called "logistic" because it's based on the logistics of survival—specifically, the concept of carrying capacity. The formula is N(t) = K / (1 + (K-N₀)/N₀ * e^(-rt)). Messy, I know. But the story behind it is simple: growth slows down as resources run out. This curve is the single most important model for understanding sustainable systems. Honestly, if you only learn one shape, learn this one.
The key parameter here is "K"—the carrying capacity. This is the maximum population that the environment can support indefinitely. In ecology, it's the number of deer a forest can feed. In business, it's the total addressable market. In viral spread, it's the number of susceptible individuals. The logistic S curve starts similar to the J-curve, but instead of going vertical forever, it bends over and flattens out. It reaches an equilibrium. It's a boring shape compared to the J-curve. It doesn't promise infinite riches. But it does promise reality. It promises that your system won't crash and burn.
The S-shaped growth is everywhere once you learn to see it. The adoption of new technology nearly always follows an S-curve. Think about smartphones. In the early 2000s, almost nobody had one. Then adoption accelerated as prices dropped and networks improved—that was the exponential phase. Now, adoption has flattened because almost everyone who wants one already has one. That's the top of the logistic S curve. The same pattern holds for market saturation, disease spread (with immunity), and even the growth of a mature company. The difference between exponential J curves and logistic curves is the existence of that upper limit.
But here is the kicker: the S-curve isn't just one curve. In a complex system, you can have multiple S-curves stacked on top of each other. This is called a "compound S-curve" or a "staircase of innovation." When one technology hits its ceiling, a disruptive innovation creates a new S-curve with a higher carrying capacity. This is how entire industries evolve. The J-curve is a moment. The S-curve is a phase. The compound S-curve is a saga. Understanding logistic S curves gives you the patience to see through the hype and recognize when growth is genuinely slowing down versus when it's just taking a breath before a new cycle.
Carrying Capacity: The Invisible Ceiling
Carrying capacity (K) is the single most misunderstood concept in growth dynamics. It's not a fixed number. It changes with technology, with culture, and with competition. The carrying capacity of a city for humans is vastly different today than it was in 1800, because we invented skyscrapers, sewage systems, and agriculture. But at any given moment, there is a limit. The logistic S curve is a model of approaching that limit. As you get close, growth slows down. This is called "density-dependent growth." The closer you get to K, the harder it is to grow.
Think of it like filling a glass of water. The first few drops are easy. The next few splash around. But as you approach the rim, you have to slow down to a trickle to avoid spilling. That's the difference between exponential J curves and logistic S curves. The J-curve assumes the glass is infinitely tall. The S-curve knows the glass has a rim. In the real world, every system has a rim. Your social media platform has a finite number of humans on the planet. Your local coffee shop has a finite number of customers in the neighborhood. Your forest has a finite amount of sunlight and soil nutrients.
Identifying the carrying capacity early is the secret to avoiding the crash. I've seen companies that grew at 20% month-over-month until they hit 50% market share, and then they panicked because growth dropped to 5%. They thought something was broken. It wasn't. They were just reaching the rim of the glass. The shift from exponential to logistic growth is not a failure—it's a maturation. It's the system telling you to change your strategy from acquisition to retention. From expansion to optimization. From growth at any cost to sustainable profitability. The logistic S curve teaches you to respect the ceiling.
The Logistics of a Logistic Curve
Let's get practical for a moment. How do you know which curve you're riding? Look at your data over time. If your growth rate (percentage increase) is constant, you're on a J curve. If your growth rate is declining, you're transitioning to an S curve. This is a simple check. Plot your daily or weekly growth rate. Is it flat? That's exponential. Is it trending downward? That's logistic. Most people make the mistake of looking only at absolute numbers. They see 100 new users a day and think it's great, without realizing that the percentage growth is actually falling. That's a lagging indicator of trouble.
Here's another practical difference. The exponential J curve is driven by intrinsic properties (your "r"). The logistic S curve is driven by the environment (your "K"). If you want to keep growing, you have two levers. You can increase your "r" (make the product more contagious, improve conversion rates) or you can increase your "K" (expand into new markets, invent new use cases). Many companies spend all their energy on "r" and ignore "K." That's like trying to fill the same glass faster when you're already at the rim. It only works until it doesn't, and then you spill. The smart play is to invest in raising the ceiling while you still have growth momentum.
I use this distinction constantly in my work. When a client says "our growth is slowing down," I ask: is your growth rate still increasing? If yes, you're still in the J-curve phase and you have time. If no, you're hitting the S-curve inflection point, and you need to immediately refocus on carrying capacity. The difference between exponential J curves and logistic S curves is not just academic. It's a diagnostic tool. It tells you whether to accelerate or to consolidate. It tells you whether you're in a sprint or a marathon. It tells you whether you need to pop champagne or panic.
Why the J-Curve Is a Liar (and the S-Curve Is Your Friend)
The exponential J curve is a liar because it ignores constraints. It presents a fantasy of infinite growth. It seduces investors, founders, and policymakers into believing that the good times will never end. And then reality hits. The housing market crashes. The population collapses. The startup goes bankrupt. The J curve is the shape of a bubble, not a building. It's exciting to watch, but it's terrifying to live through on the downside. I've seen too many careers destroyed by people who mistook a J-curve for a permanent trend. They didn't plan for the plateau, so they had no strategy for the crash.
The logistic S curve, by contrast, is your friend. It's honest. It admits that growth is hard and that limits are real. But it also offers a path to stability. The S-curve tells you where you're going. It gives you a target—the carrying capacity. You can plan for it. You can optimize for it. You can build a business or an ecosystem that thrives within those limits. It's not as sexy as the J-curve. Nobody writes a headline about a company that reached market saturation and then maintained a 5% growth rate for a decade. But that company is profitable. It's steady. It's real. It's the difference between a viral hit and a classic film.
Let's be blunt: the world is largely governed by S-curves. Human population growth, which was exponential for centuries, is now clearly following a logistic pattern. We're approaching the global carrying capacity. The difference between exponential J curves and logistic S curves is the difference between living in a fantasy and living in reality. If you base your decisions on the J-curve, you will be constantly surprised by collapses. If you base them on the S-curve, you will anticipate plateaus and plan for them. You will be the person who sees the bend before it happens, and you will position yourself accordingly. That's the power of this simple distinction.
Real-World Examples: Where You'll Find Both Curves
Let me give you three concrete examples from different fields that illustrate the difference between exponential J curves and logistic S curves.
- Viral Memes vs. Viral Diseases: A meme that takes off on Twitter often follows a perfect J-curve. It spreads exponentially until everyone who is interested has seen it, and then it dies out abruptly—a crash. But a real virus, like measles, follows an S-curve. It spreads exponentially among the unvaccinated, but once enough people are immune (the carrying capacity), the spread slows down and eventually stops. The J curve describes a fad. The S curve describes a disease reaching herd immunity.
- Startup Growth: Many startups experience a short-term J-curve during their initial user acquisition phase, especially if they have a viral loop. But to survive, they must transition to an S-curve. The ones that fail are the ones that believe the J-curve will last forever and don't invest in the product, infrastructure, or customer support needed to handle a plateau. The ones that succeed are the ones that treat the J-curve as a limited-time window and use it to raise the carrying capacity of their market. They expand into new verticals or geographies.
- Technological Adoption: The adoption of any new technology—from color TV to the internet to AI—follows an S-curve. The early adopters are slow. Then the mainstream catches on, and growth explodes (the middle of the S). Then it saturates. The difference between exponential J curves and logistic S curves here is critical for investors. If you invest in a new technology during the early exponential phase (the J-curve part of the S), you can make a fortune. But if you invest too late, when the S-curve has flattened, you're buying into a mature market with limited upside. Recognizing where you are on the curve is everything.
Common Questions About the Difference Between Exponential J Curves and Logistic S Curves
Can a J-curve ever turn into an S-curve?
Yes. In fact, a true logistic S curve actually contains a J-curve within it. The early phase of an S-curve is exponential. The growth is nearly identical to a pure J-curve until the population gets close to the carrying capacity. So the J-curve is not a separate thing—it's the first half of the S-curve. The problem arises when growth keeps going beyond the carrying capacity, which is when you get the crash. A well-managed system transitions from the exponential phase to the plateau without crashing.
Which curve is better for forecasting?
The logistic S curve is almost always better for forecasting over the long term. The exponential J curve is only useful for very short-term forecasts in a resource-rich environment. If you try to forecast using a J-curve for more than a few time steps, your numbers will quickly become absurd. The S-curve, by including a ceiling, gives you realistic bounds. It's the difference between saying "we will have 100 million users next year" and saying "we will eventually saturate at around 50 million users, and we are 20% of the way there."
Is the J-curve ever useful for positive change?
Absolutely. The J-curve is a powerful force for good when used in contexts where the carrying capacity is very high or can be expanded. For example, the spread of a beneficial idea, like a medical breakthrough or an educational program, can follow a J-curve in its initial phase. The key is to recognize that the J-curve is a tool for acceleration, not for permanence. Use it to reach the ceiling faster, then shift to an S-curve strategy for long-term sustainability. It's the best engine for takeoff, but a terrible one for cruising.
How do I calculate the carrying capacity for my system?
This is the million-dollar question. Carrying capacity is rarely a fixed number; it's a moving target. In business, you can estimate it by looking at the total addressable market (TAM) and your realistic market share. In ecology, you can look at the average population size over time. A good rule of thumb is to look at historical data and see where growth started to slow. That inflection point is usually around half the carrying capacity. The math is elegant: on an S-curve, the maximum growth rate occurs at K/2. So if you can find your peak growth rate, double that population number, and that's a rough estimate of your logistic S curve ceiling.
Can a logistic S-curve also crash?
Yes, it can. A logistic S-curve assumes that the system approaches the carrying capacity smoothly and stabilizes. But in reality, systems often overshoot K and then crash, creating a pattern called a "