
How to Calculate and Interpret the Combined Units of Covariance
Let me ask you something. Have you ever stared at a covariance output and thought, “Great, but what does this number actually mean?” You’re not alone. I’ve spent over a decade working with financial models, risk assessments, and statistical analyses, and I still see analysts get tripped up by this. The problem isn’t the calculation—it’s the interpretation. Specifically, it’s the units. When you combine two variables, their covariance doesn’t just pop out as a clean, dimensionless number. It carries baggage. Real, messy, unit-based baggage. And if you don’t know how to read that baggage, you’re flying blind.
Look—covariance tells you how two variables move together. Positive covariance? They rise and fall in sync. Negative covariance? They’re doing the opposite dance. But the magnitude? That’s where the combined units of covariance come in. It’s not a correlation coefficient. It’s not a standardized score. It’s the raw, unscaled relationship. And that raw relationship has units that are the product of the two original variables. Seriously. If you’re measuring height in centimeters and weight in kilograms, your covariance is in centimeter-kilograms. That’s a weird unit. It’s a big deal because without understanding this, you can’t compare covariances across different datasets. Let’s fix that.
Why the Units of Covariance Actually Matter (And Why Most People Ignore Them)
I’ve seen people calculate covariance, get a number like 45.6, and immediately start comparing it to another covariance of 12.3. That’s a trap. Without knowing the combined units of covariance, you’re comparing apples to, well, apple-shaped oranges. The unit is literally the product of your two variables’ units. If you’re analyzing stock returns in dollars and trading volume in shares, your covariance is in dollar-shares. That’s not a unit you encounter every day. It’s a big deal because it means the number’s scale is entirely dependent on the measurement scales you chose.
Here’s a concrete example from my own work. I once helped a retail chain analyze the relationship between store square footage and monthly revenue. Square footage was in thousands of square feet. Revenue was in millions of dollars. The covariance came out to 2.4. That number? It’s in “thousand-square-foot-millions-of-dollars.” Honestly? That’s a nightmare to interpret on its own. But when I normalized it into a correlation coefficient, it became a clean 0.87. That’s the trick. The covariance itself is a stepping stone. The units tell you the raw relationship’s scale, but the interpretation requires context.
The Calculation: Breaking Down the Combined Units Step by Step
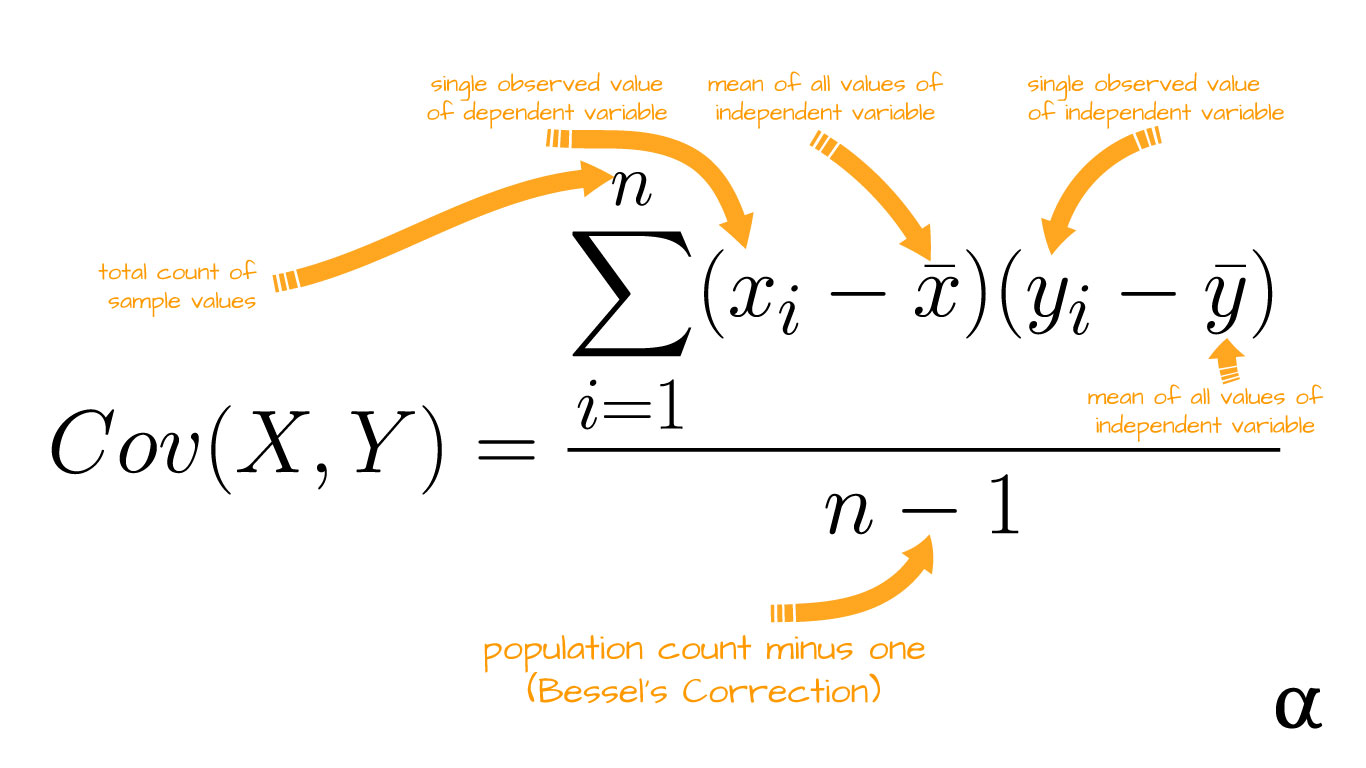
Let’s get into the mechanics. The formula for covariance between two variables X and Y is the average of the products of their deviations from their means. In plain English: you take each pair of data points, subtract their respective means, multiply those differences together, sum them up, and divide by n-1 (for sample covariance) or n (for population). The combined units of covariance emerge from that multiplication step. If X is in meters and Y is in seconds, each product term is in meter-seconds. The sum and average don’t change the unit—they just scale it.
- Step 1: Calculate the mean of X and the mean of Y. These keep the original units. - Step 2: For each data point, compute (X – mean of X) and (Y – mean of Y). These deviations are in the original units. - Step 3: Multiply those deviations together. The result is in (unit of X) * (unit of Y). - Step 4: Sum all those products and divide by n-1 or n. The unit remains the product of the original units.
It’s that simple. The combined units of covariance are a direct consequence of the multiplication. If you’re working with financial data—say, asset returns in percentages and market volatility in percentage points—your covariance is in percentage-squared. That’s a common one, and it’s why people often prefer correlation. But here’s the thing: covariance’s units aren’t a bug; they’re a feature. They tell you the scale of co-movement in the original measurement system. You just have to know how to read them.
Interpreting the Combined Units: When the Number Makes Sense (and When It Doesn’t)
Alright, so you’ve got your covariance. Let’s say it’s 15.6 with units of “kilogram-meter-squared per second” (because you were analyzing force and acceleration—don’t ask). What does that mean? Honestly? On its own, almost nothing. The combined units of covariance are only interpretable relative to the scales of your variables. A covariance of 15.6 could be massive if your variables range from 0 to 10, or tiny if they range from 0 to 10,000. That’s why you never, ever interpret covariance magnitude without context.
Here’s a rule of thumb I’ve used for years: always pair covariance with the standard deviations of both variables. The product of the standard deviations gives you the maximum possible absolute covariance. So if your covariance is 15.6 and the product of the standard deviations is 30, you’re looking at a fairly strong positive relationship. But if that product is 300, your covariance is weak. This is where the combined units of covariance become a diagnostic tool. They force you to think about scale. They prevent you from making the rookie mistake of comparing covariances from different datasets without normalization.
Common Pitfalls in Interpreting Combined Units
I’ve seen three major mistakes over the years. First, people treat covariance like a correlation coefficient. They see a high number and assume a strong relationship, ignoring the units entirely. Second, they try to compare covariances across different variable pairs without accounting for unit differences. For example, comparing covariance of height and weight (in cm-kg) to covariance of income and education (in dollars-years). That’s meaningless. Third, they forget that covariance is sensitive to outliers. A single extreme data point can inflate the combined units of covariance dramatically because the product of deviations gets squared in a sense—well, not squared, but amplified.
- Pitfall 1: Ignoring the unit entirely. Always state the unit when reporting covariance. - Pitfall 2: Comparing covariances across different measurement scales. Use correlation instead. - Pitfall 3: Forgetting that covariance is unbounded. There’s no upper or lower limit, so context is everything.
Seriously, I once saw a research paper claim a “high covariance” of 500 between two economic indicators. The units were in trillions of dollars and percentage points. That 500 was actually tiny relative to the scale. The authors had no idea. Don’t be those authors.
Practical Examples: Walking Through Real-World Combined Units
Let’s make this concrete. Imagine you’re analyzing the relationship between daily temperature (in degrees Celsius) and ice cream sales (in hundreds of dollars). You collect 30 days of data. The covariance comes out to 12.4. The combined units of covariance are Celsius-hundred-dollars. What does that tell you? It tells you that as temperature deviates from its mean by 1 degree, ice cream sales tend to deviate from their mean by a certain amount. But the exact magnitude? You need the standard deviations.
- Standard deviation of temperature: 5.2 degrees Celsius. - Standard deviation of sales: 8.1 hundred dollars. - Product of standard deviations: 5.2 * 8.1 = 42.12 Celsius-hundred-dollars. - Covariance: 12.4 Celsius-hundred-dollars. - Correlation: 12.4 / 42.12 = 0.294.
So the relationship is positive but weak. The combined units of covariance gave us the raw number, but the correlation gave us the interpretable strength. Notice how the units canceled out in the correlation calculation? That’s why correlation is unitless. But covariance? It keeps the units, and that’s useful when you’re building models that need the original scale, like in portfolio variance calculations.
When You Actually Need the Combined Units
Here’s where the combined units of covariance become your best friend: in finance. When you calculate the variance of a portfolio, you’re summing up weighted covariances between every pair of assets. Those covariances have units that are the product of the asset return units. If returns are in percentages, your covariance is in percentage-squared. The portfolio variance is in percentage-squared. To get the standard deviation (risk) in percentage, you take the square root. That square root operation only works because the units are consistent. If you ignored the combined units of covariance, you’d mess up the entire risk calculation.
Another example: in engineering, when you’re analyzing the covariance between force and displacement, the units (Newtons * meters) directly relate to work or energy. That’s not a coincidence. The combined units of covariance often have a physical interpretation. In economics, covariance between consumption and income (in dollars-squared) relates to risk aversion parameters. It’s not just a number—it’s a bridge between statistics and the real world.
Common Questions About How to Calculate and Interpret the Combined Units of Covariance
What exactly are the combined units of covariance?
The combined units of covariance are the product of the units of the two variables you’re analyzing. If variable X is measured in meters and variable Y is measured in seconds, the covariance is in meter-seconds. This unit arises directly from the multiplication step in the covariance formula. It’s not dimensionless, and it’s crucial for interpreting the scale of the relationship.
Why can’t I just use correlation instead of dealing with covariance units?
You can, and often you should. Correlation is covariance divided by the product of the standard deviations, which makes it unitless and bounded between -1 and 1. However, covariance is essential for calculations like portfolio variance, regression coefficients, and multivariate statistics. The combined units of covariance are necessary for these applications because they preserve the original measurement scale.
How do I interpret a covariance value if I don’t know the units?
You can’t. That’s the honest answer. Without knowing the combined units of covariance, the number is meaningless. Always report the units alongside the covariance value. If you’re reading someone else’s work and they omit the units, ask for them. It’s a red flag.
Does the sample size affect the combined units of covariance?
No, the units remain the same regardless of sample size. The sample size affects the precision of the estimate but not the unit. However, the calculation method (dividing by n vs. n-1) changes the numerical value slightly but keeps the unit identical. The combined units of covariance are invariant to sample size.
Can the combined units of covariance be negative?
Yes, and the unit doesn’t change. Negative covariance simply means the variables move in opposite directions. The unit remains the product of the original units. For example, if you have negative covariance between temperature and heating costs, the unit might be Celsius-dollars, and the negative sign indicates an inverse relationship.
So there you have it. The combined units of covariance aren’t some obscure statistical footnote. They’re the key to understanding what your covariance number actually represents. Next time you calculate one, don’t just jot down the number. Write the unit next to it. Think about what that unit means in the real world. It’ll save you from misinterpretation, and it’ll make you look like the expert you are.